Nov 20, 2023 By Susan Kelly

A trader has to be knowledgeable not only in analysis but also in risk management and Trend Trading psychology. There is no one technical signal that would guarantee financial success in the market. However, certain trading methods have weathered the test of time and continue to be widely used as tools by trend traders interested in examining specific market indicators.
Moving Averages
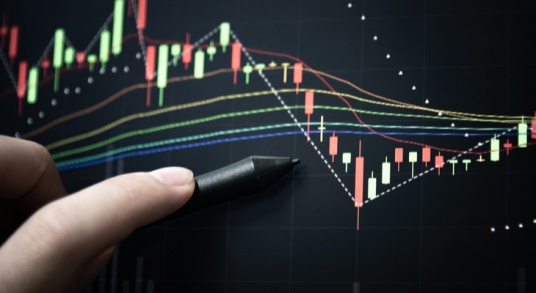
The moving average is a technical analysis technique used to make price data more consistent by calculating a continually updated average price. When applied to a chart of prices, a moving average generates a single, horizontal line that, in essence, removes any variances that random price movements would have caused. The average is calculated over a predetermined amount of time, which might be ten days, twenty minutes, thirty weeks, or any other amount of time that the trader sees fit. The 200-day, 100-day, and 50-day simple moving averages are three of the most used choices among traders, investors, and others who monitor long-term trends.
The moving average may be used in several different contexts. The first thing you need to do is check out the inclination of the moving average. Prices are considered to be ranging rather than trending when they spend a significant period largely moving side to side rather than up and down. When an asset trades between constant high and low values over some time, this is known as a trading range for that security. If the moving average line is sloping upward, this indicates that an upward trend is currently active. Moving averages, on the other hand, do not provide forecasts about the value that a stock will have in the future; rather, they only reflect what the price is doing on average over some time. When the price of an asset crosses above a moving average, this phenomenon may be seen as a buy signal; conversely, when the price of an asset crosses below a moving average, this phenomenon can be interpreted as a sell signal.

Moving Average Convergence Divergence (MACD)
One kind of oscillating indicator is known as the moving average convergence divergence (MACD). An oscillating indicator is used in technical analysis that fluctuates with time inside a band. It is an indicator that follows trends as well as one that measures momentum. Checking the histogram shown underneath the chart to see which side of zero the MACD lines are on is a fundamental part of using the MACD method. If the MACD lines remain above zero for an extended time, the stock price is most likely moving in an upward direction. On the other hand, if the MACD lines stay below 0 for an extended time, the trend is most certainly heading downward. This trading method generates possible purchase signals whenever the MACD rises above zero, and possible sell signals are generated whenever the MACD crosses below zero.
The Relative Strength Index (RSI)
Information distinct from that provided by the MACD. When the indicator in the histogram is above 70, one interpretation of the RSI is to view the price as "overbought," indicating that it is due for a correction. When the indicator is below 30, one interpretation of the RSI is to view the price as "oversold," indicating that it is due for a bounce.

Whenever there is a robust upward trend, the price will often hit 70 and even higher for extended periods. In the case of downward trends, the price may remain at 30 or below for an extended period. Even though overall overbought and oversold levels may sometimes be correct, trend traders should be aware that these levels may not always deliver the most timely indications. An additional strategy is to make a short trade close to an overbought state when the trend is downward and a long trade close to an oversold condition when the trend is upward.
On-Balance Volume (OBV)
The on-balance volume (OBV) takes a substantial quantity of volume information and collects it into a single one-line indication. Volume alone is a powerful indicator, and OBV takes this information and combines it. The cumulative buying and selling pressure is determined by taking the volume on days when prices are "up" and adding it to the volume on days when prices are "down." In an ideal world, the volume should validate the patterns. If the price is going up, the OBV should go up as well; if the price is going down, the OBV should also go down.
-

Buying a Leased Car
Oct 21, 2023
-

Analyzing the Business Model and Revenue to Understand How Does Fortnite Makes Money
Dec 06, 2023
-

Essentials of Bird Dogging in Real Estate for Beginners and Field Pros
Dec 22, 2023
-

The Long, Weird History of Universal Basic Income—and Why It’s Back
Feb 20, 2024
-

Find Out: What Are the Minimum Number of Shares You Can Buy?
Nov 06, 2023
-

What is Bull Put Credit Spread
Nov 10, 2023
-

What Is Contractors Professional Liability Insurance?
Nov 19, 2023
-

How Long Is An Appraisal Good For?
Jan 07, 2024


